Statistics Board: Difference between revisions
No edit summary |
|||
| (10 intermediate revisions by 2 users not shown) | |||
| Line 1: | Line 1: | ||
{{usermanuals}} | |||
=Introduction= | =Introduction= | ||
The | The RangerMSP Statistics Board provides a quick access to advanced queries providing summary or statistical information regarding your business. The queries results can help you keep track of the different measures of your business. | ||
For example, you will be able to see | For example, you will be able to see the number of open Tickets by status, average open time for tickets, total charge amounts and more. All statistics can be filtered by employees and dates, and compared with other employees and dates. | ||
The Statistics Board comes with predefined database queries grouped by subject. Each user can easily choose which queries to show, allowing personal data view for each user. | The Statistics Board comes with predefined database queries grouped by subject. Each user can easily choose which queries to show, allowing personal data view for each user. | ||
| Line 17: | Line 16: | ||
# Ability to define highlighting colors and boundaries for each color. | # Ability to define highlighting colors and boundaries for each color. | ||
<br> | <br> | ||
=Using the Statistics Board= | =Using the Statistics Board= | ||
To open the Statistics Board click the Statistics Board icon in the applications toolbar: | To open the Statistics Board click the Statistics Board icon in the applications toolbar:<br> | ||
< | [[File:Statistics_board_button.png|center]] | ||
The following window opens: | The following window opens:<br> | ||
[[File:Statistics_board_overview.gif]] | [[File:Statistics_board_overview.gif|center]] | ||
In this window you can find the following data: | In this window you can find the following data: | ||
| Line 40: | Line 40: | ||
* '''Set Properties''' – to set the properties for each query (such as font color, name, etc.) click the Properties button. See more details in [[Statistics_Board#Statistics_Properties|Statistics Line Properties]]. | * '''Set Properties''' – to set the properties for each query (such as font color, name, etc.) click the Properties button. See more details in [[Statistics_Board#Statistics_Properties|Statistics Line Properties]]. | ||
=Statistics Line Properties= | ==Statistics Line Properties== | ||
To define each line's properties, click the Show Statistics Line Properties Window link next to the Statistics name. | To define each line's properties, click the Show Statistics Line Properties Window link next to the Statistics name. | ||
| Line 53: | Line 53: | ||
* '''Name (Custom)''' - Use the custom name to rename the Statistics Line and | * '''Name (Custom)''' - Use the custom name to rename the Statistics Line and show a different text in the results window. | ||
* '''Text Color Rules''' - Here you can determine the text colors to blue (the default color), green or red according to boundaries you define. For example, show result in red if result value is between 100-200. | * '''Text Color Rules''' - Here you can determine the text colors to blue (the default color), green or red according to boundaries you define. For example, show result in red if result value is between 100-200. | ||
* '''Background Color''' - The background color is static, and is not related to the value. It helps you easily locate the queries you find more interesting in the query results list. | * '''Background Color''' - The background color is static, and is not related to the value. It helps you easily locate the queries you find more interesting in the query results list. | ||
| Line 59: | Line 59: | ||
<br> | <br> | ||
[[File:Statistics_board_properties_display.gif]] | [[File:Statistics_board_properties_display.gif]] | ||
=Statistics Filter Pane= | |||
The Filter Pane appears on the right side of the window. In this area you can define filters for the statistics results. | |||
==Filter Results== | |||
The statistics can be optionally filtered by: | |||
* Employee | |||
* Date range | |||
Filtering the results will affect the statistics performed on the left pane. | |||
To filter results: | |||
# Choose the Employee/s you want to calculate the statistics for. Click the magnifying glass to choose multiple employees. | |||
# Choose the date range. You can use the quick selection (today, this week, this month, this year), or specify a specific date range. | |||
# Click ''Refresh'' in the results pane to see the updated results. | |||
==Compare Results== | |||
The Compare option lets you compare the statistics with other criteria. This lets you compare the results for all queries against a different set of results filtered by other criteria. | |||
For example, you can compare all Ticket statistics of a specific employee with another employee and check performance for a given date range. Or, see Ticket volume this month and compare it to the same month's results in the last year. | |||
To compare results: | |||
# Click the compare pull-down menu to choose which criteria to use. | |||
# Possible options are: | |||
## Another employee. When choosing this option you need to select the employee/s to compare with using the magnifying glass. | |||
## All employees | |||
## Date range (quick-selection or custom date range). When choosing to compare to a custom date range, you need to choose the date range. | |||
# Click ''Refresh'' to see the updated results in the left pane. | |||
[[File:Statistics_board_compare.gif]] | |||
''Note: Some statistics are not filter-oriented (e.g. Ticket Manager with the smallest number of open tickets). Such statistics will appear with the '''same results''' for both compared columns.'' | |||
=Export to Excel= | |||
To export the results to Excel, click ''Export to Excel'' at the top-right corner of the results pane. | |||
This will export the statistics results to an Excel sheet, so you can keep a snapshot of the current state, and manipulate the data further. | |||
=See Also= | |||
* [[Reports]] | |||
* [[Import and Export]] | |||
Latest revision as of 13:44, 8 July 2020
Introduction
The RangerMSP Statistics Board provides a quick access to advanced queries providing summary or statistical information regarding your business. The queries results can help you keep track of the different measures of your business.
For example, you will be able to see the number of open Tickets by status, average open time for tickets, total charge amounts and more. All statistics can be filtered by employees and dates, and compared with other employees and dates.
The Statistics Board comes with predefined database queries grouped by subject. Each user can easily choose which queries to show, allowing personal data view for each user.
Statistics Board Features:
- Easy access to advanced database queries showing data summaries.
- Easily filter by employee or date ranges.
- Ability to compare results to other dates or employees.
- Ability to choose which queries to display, and to rename the queries.
- Ability to define highlighting colors and boundaries for each color.
Using the Statistics Board
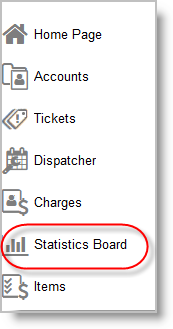
To open the Statistics Board click the Statistics Board icon in the applications toolbar:

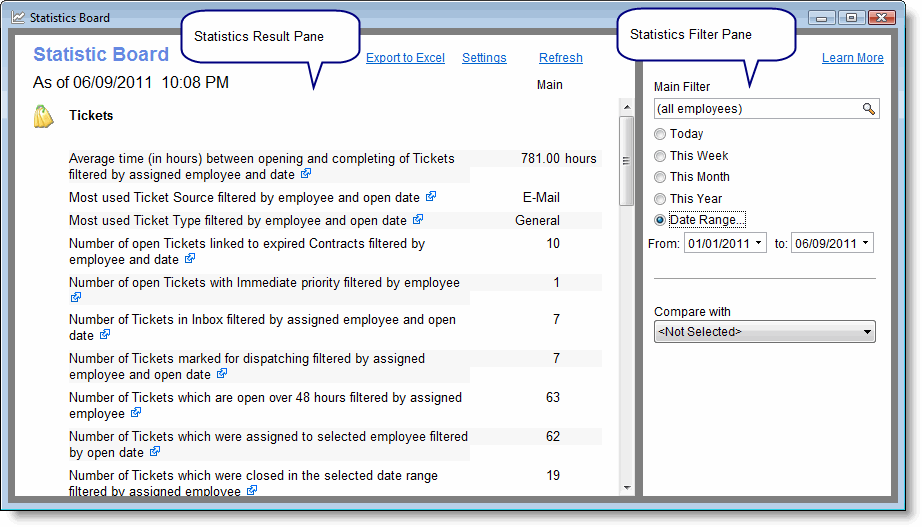
The following window opens:

In this window you can find the following data:
- Statistics Results Pane – shows the selected queries and their results, categorized by subject.
- Statistics Filter Pane – here you can define the date ranges and employees for the Statistics. In addition you can define additional Statistics to compare the results with.
Settings
To control which statistics you see each time you open the Statistics Board, click the Settings link on the top-right corner of the results pane. The following window opens:
In this window you can:
- Change Category Order - you can change the categories order by clicking the arrows next to the category list.
- Set Which Statistics are Displayed - for each category the relevant predefined statistics queries are displayed on the right pane, and you can choose which are displayed by moving them to the bottom tab (click the Display button after selecting a query you want to add to the display).
- Set Properties – to set the properties for each query (such as font color, name, etc.) click the Properties button. See more details in Statistics Line Properties.
Statistics Line Properties
To define each line's properties, click the Show Statistics Line Properties Window link next to the Statistics name.
This window can also be access from the Statistics Board Settings window when clicking Properties for each Statistics Line.
The following window opens:
- Name (Custom) - Use the custom name to rename the Statistics Line and show a different text in the results window.
- Text Color Rules - Here you can determine the text colors to blue (the default color), green or red according to boundaries you define. For example, show result in red if result value is between 100-200.
- Background Color - The background color is static, and is not related to the value. It helps you easily locate the queries you find more interesting in the query results list.
- Text Style - Allows you to show the results for this query as bold.
Statistics Filter Pane
The Filter Pane appears on the right side of the window. In this area you can define filters for the statistics results.
Filter Results
The statistics can be optionally filtered by:
- Employee
- Date range
Filtering the results will affect the statistics performed on the left pane.
To filter results:
- Choose the Employee/s you want to calculate the statistics for. Click the magnifying glass to choose multiple employees.
- Choose the date range. You can use the quick selection (today, this week, this month, this year), or specify a specific date range.
- Click Refresh in the results pane to see the updated results.
Compare Results
The Compare option lets you compare the statistics with other criteria. This lets you compare the results for all queries against a different set of results filtered by other criteria.
For example, you can compare all Ticket statistics of a specific employee with another employee and check performance for a given date range. Or, see Ticket volume this month and compare it to the same month's results in the last year.
To compare results:
- Click the compare pull-down menu to choose which criteria to use.
- Possible options are:
- Another employee. When choosing this option you need to select the employee/s to compare with using the magnifying glass.
- All employees
- Date range (quick-selection or custom date range). When choosing to compare to a custom date range, you need to choose the date range.
- Click Refresh to see the updated results in the left pane.
Note: Some statistics are not filter-oriented (e.g. Ticket Manager with the smallest number of open tickets). Such statistics will appear with the same results for both compared columns.
Export to Excel
To export the results to Excel, click Export to Excel at the top-right corner of the results pane.
This will export the statistics results to an Excel sheet, so you can keep a snapshot of the current state, and manipulate the data further.


