Report Designer User Guide: Difference between revisions
| Line 633: | Line 633: | ||
<br> | <br> | ||
====Secondary Filters==== | ====Secondary Filters==== | ||
When using reports that mix multiple data sources in the same report, it may sometimes become necessary to apply second level filtering options in order to narrow the list down to the items you need to be displayed in your report. | When using reports that mix multiple data sources in the same report, it may sometimes become necessary to apply second level filtering options in order to narrow the list down to the items you need to be displayed in your report. | ||
Revision as of 16:39, 8 January 2010
Introduction
In this documentation, you will find information about how to use the Report Builder to customize your reports to fill the needs of your business and your respected customers. Keep reading in order to find help on the different toolbars, group management, headers and footers, and the rest of the tools the Report Builder has to offer you.
Loading The Report Designer
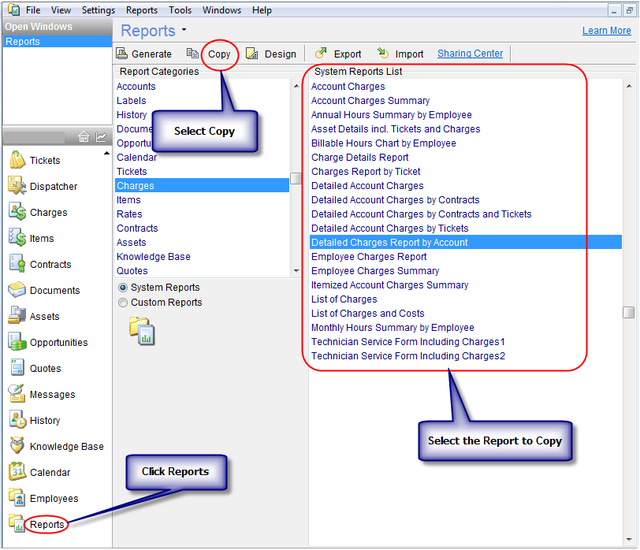
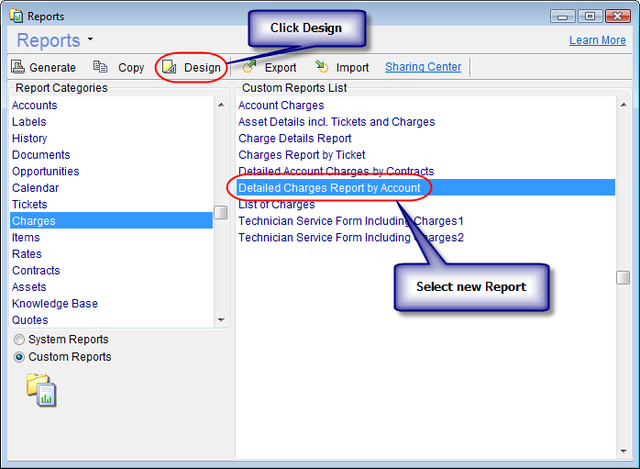
The report Designer can be accessed by selecting an existing report that is similar to the report you want to generate. It is very important to identify an existing report which can serve as the basis for the customized report you wish to generate. You must take into consideration when choosing the report both its layout and its data structure. Every report has predefined data source relations and fields that can be selected. To customize CommitCRM reports, open the Reports window, select the report you want to customize, select Copy from the toolbar and enter your new report name. The copied report will be selected. Select the Design button from the toolbar, and the report designer will open.
- Open CommitCRM, and go to the Reports Screen.
- Select the base report that you will be editing to your own needs.
- The base report can be selected from System based or Custom based reports.
- Select the Copy Option from the toolbar.
- Give your report a new name.
- Switch to Custom Reports.
- Choose your new report.
- Click Design from the toolbar.
The Designing Environment
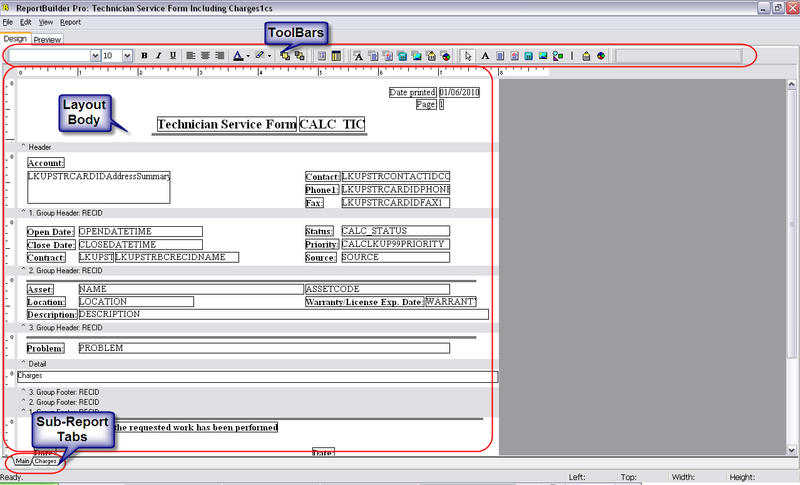
- In this view, you are free to manipulate the position or size of any of the text labels or the data components. In the Default view shipped with the designer, you’ll notice there is a single tab (multiple tabs in some reports), the lower part of the screenshot above, your layout in the middle. Also, you’ll see 5 visible toolbars in a grouped configuration, there are also 5 hidden toolbars. These toolbars are as follows.
- For a video illustrating the finer points of customizing CommitCRM reports, Please click here.
Visible Toolbars
Standard Components

- The Standard components are basically text labels, images, shapes, charts or barcodes. These components are static by nature, meaning that their contents are predetermined during design usually for writing the text labels, inserting company logo or even a chart.
The items in the toolbar are as follows (By order of Left to Right).
| Component | Description |
|---|---|
| Select object (Arrow) | This is the tool used to select an item or multiple items by holding CTRL. |
| Label | This is the component used to set small basic text labels. i.e. Name: Address: Ph#: |
| Memo | This text component is used for displaying larger amounts of fixed text that the Label component offers. This component is useful for disclaimers, Terms Of Services, etc. |
| Rich Text | The Rich Text component allows you to activate the Rich Text Editor by right clicking the RTF field and choosing Edit. This allows you to use line breaks, and different formatting features. |
| Calc | This tool allows you to add time/date stamps, page indicator stamps, date printed stamp, etc. by placing a component and selecting a function from the edit bar. |
| Image | This tool allows you to insert a predetermined picture to the report. |
| Shape | This tool allows you to insert simple shapes to the report, by clicking the icon, selecting a shape from the edit bar, and placing the component in the report. |
| Line | This tool allows you to place continuous or broken lines to the reports. |
| Barcode | This tool allows you to mark each report with the same barcode image. If you would like the barcode to be chosen, please use DBBarcode. |
| Chart | This tool allows you to insert a static chart that will also be shown in an identical fashion on each report. |
Data Components

- The data components are the items used to insert data from the CommitCRM Database into your report. These fields cross reference and list the data in the reports that you will later use to present to your customers, and use in the office to organize the workflow not just for you, but your whole business. These reports include technician service summary quotations, charge lists, account history printouts, Charts, lists, and much more.
The items in the toolbar are as follows(By order of Left to Right):
| Component | Description |
|---|---|
| DBText | This tool allows you to insert short text fields from the database. The selected field in the edit bar such as Accounts – Name, is later cross referenced with the stipulations in the report generation window. Note that for each type of report, different combinations of fields are available, we’ll get into that later in this manual. |
| DBMemo | This tool allows you to insert larger text memos from the database in the same manner as the previous tool. It is resizable in the report generator, and is ideal for Ticket Description, Account Notes, Charge Description, etc. |
| DBRichText | This tool allows you to insert large amounts of text from the database and inserted with rich formatting capabilities. There’s an editor if you right click the component in your layout and choose Edit. |
| DBCalc | This tool allows you to place simple mathematical formula such as SUM, AVERAGE, MIN, and MAX into your reports. Just right click the field select Calculations... to set your formula. Then select the database field to be associated with this formula from the edit bar. |
| DBImage | This tool allows you to insert images referenced in the database into the report. |
| DBBarCode | This tool allows you to insert database referenced barcodes into your report for stuff like asset code, serial numbers, etc.. This is useful if you use barcodes to identify assets, accounts, and items. The report will display the barcodes in a standard barcode format, unless the user selects a different barcode format to be used. |
| DBChart | This tool allows you to insert a chart into your report that calculates all the entries in report and displays the results in an easily readable report. Customers love these things… This is an advanced option and may be difficult to fine tune. We suggest using them as they are in reports that already have them, or to export your data to Excel and use Excel’s charting tools, for more powerful features. Alternatively, if you're an advanced user, you can configure the CommitCRM ODBC Connector to serve as an information conduit from the CommitCRM database right into your Excel Charts. |
Advanced Components

Use of the advanced components is used for separation and sub-reporting. There’s only 2 of them, but you’ll use them plenty. The items in the toolbar are as follows (By order of Left to Right):
| Component | Description |
|---|---|
| Region | This tool allows you to mark a section reserved for small DB fields like Name, Address1, Address2, etc. so that different sections in the smaller, more delicate parts of the report are preserved. |
| Sub-Report (Advanced) | This tool allows you to generate separate layout window for parts within the report. For example, in a charge report for tickets, the charges list can be arranged as a sub report for easier layout settings. This operation creates a tab on the lower edge on the left side named by the value in the component’s edit field. Once the component is positioned, you can switch to the next tab, and start creating your Sub Report. |
| Note: Each Sub Report uses their own data sources and should be used carefully, it's generally recommended to use already-existing sub reports when available. Creating new sub reports should be consulted with the Commit support team to assure best results. |
Edit

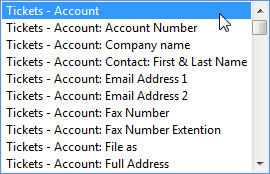
- The edit bar is used to select the value of the component you’ve just selected in your layout. If you’ve selected a text component or a memo component, you’ll see the inputted text in the edit bar. If you’ve selected a DB component, you’ll see the category – fieldname, and you’ll be able to choose any different field available by dropping this field to a menu.
Format

- This toolbar looks familiar enough, they can be used to reformat your text and control the object depth.
The items in the toolbar are as follows (By order of Left to Right):
| Component | Description |
|---|---|
| Font Selector | This tool allows you to change the selected font for text display. E.g. Times New Roman, Arial, Tahoma, etc. |
| Font Size Selector | This tool allows you to change the size of the text selected. |
| Bold | This tool allows you to make bold text. |
| Italics | This tool allows you to make italic text. |
| Underline | This tool allows you to make underlined text. |
| 3 Text Positioning Modes | These tools allows you to switch the text alignment with in each component placed on the layout. (Left, Center, Right). |
| Font Color | This tool allows you to use colored letters in your reports. |
| Highlight Color | This tool allows you to use colored text backgrounds. |
| Bring to Front | This tool allows you to bring an object to the top level, so it is visible over the others below it. |
| Send to Back | This tool allows you to place an object in the background so that other objects can cover it. |
Hidden ToolBars
The hidden toolbars must be opened to be used. There are 2 ways to open them. The first way is from View menu > Toolbars, and the second method is to right-click an existing toolbar and select from the context menu that shows up. The menus hidden by default are as follows:
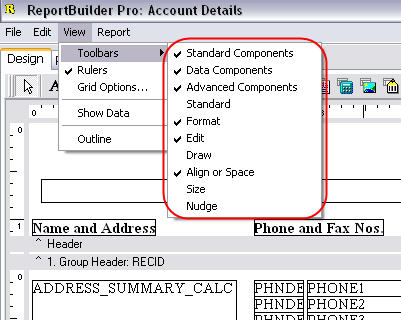
Standard

This toolbar is used for file, printer and clipboard tasks. The items in the toolbar are as follows (By order of Left to Right):
| Component | Description |
|---|---|
| Open | This tool allows you to open files saved in the Report Designer in to the current document. |
| Save | This tool allows you to save the current layout as a file loadable by Report Builder in to other reports. |
| Page Setup | This tool allows you to select the different options about page size and orientation. |
| This tool allows you to print the layout/preview as displayed in the builder. If you want one with database entries, try generating the report. | |
| Print Preview | This tool allows you to see what you’re going print before you waste ink or a page. |
| Cut | This tool allows you to cut the selected entities to the clipboard. This removes the original. |
| Copy | This tool allows you to copy to the clipboard, without removing the original. |
| Paste | This tool allows you to paste the contents of the clipboard into your report. |
Draw

The Draw toolbar allows you to draw simple shapes inside the report. The items in the toolbar are as follows (By order of Left to Right):
| Component | Description |
|---|---|
| Fill Color | This tool allows you to fill any shape created with these tools to any color you choose. |
| Line Color | This tool allows you to change the color for the selected line, or lines pending creation. |
| Line Thickness | This tool allows you to adjust the thickness of the selected line or any lines pending creation. |
| Line Style | This tool allows you to generate broken lines, continuous lines, and other similar styles. |
Align or Space

These tasks are used to reposition the selected component/s with a stipulation. This makes organizing the report much easier to keep orderly. The items in the toolbar are as follows (By order of Left to Right):
| Component | Description |
|---|---|
| Align Left | This tool allows you to shift the selected component to the left side of the document. |
| Align Center | This tool allows you to shift the selected component to the center of the row it’s on. |
| Align Right | This tool allows you to shift the selected component to the right side of the document. |
| Align Top | This tool allows you to shift the selected component to the top of the page. |
| Align Middle | This tool allows you to shift the selected component to the middle of the document page. |
| Align Bottom | This tool allows you to shift the selected component to the bottom of the page. |
| Space Horizontally | This tool allows you to select multiple components and have them evenly spaced horizontally. |
| Space Vertically | This tool allows you to select multiple components, and have them evenly spaced vertically. |
| Center Horizontally In Band | This tool allows you to group multiple components into 1 separated horizontal field. |
| Center Vertically In Band | This tool allows you to group multiple components into 1 separated vertical field. |
Size

These tasks are to resize the selected component/s by height and width. The items in the toolbar are as follows (By order of Left to Right):
| Component | Description |
|---|---|
| Shrink Horizontally | This tool allows you to make a selected component narrower. |
| Grow Horizontally | This tool allows you to make a selected component wider. |
| Shrink Vertically | This tool allows you to make a selected component shorter. |
| Grow Vertically | This tool allows you to make a selected component taller. |
Nudge

Nudging is the term used in the Designer for moving a component in a metered distance in different directions. The items in the toolbar are as follows (By order of Left to Right):
| Component | Description |
|---|---|
| Nudge Up | This tool allows you to make a selected component move up. |
| Nudge Down | This tool allows you to make a selected component move down. |
| Nudge Left | This tool allows you to make a selected component move left. |
| Nudge Right | This tool allows you to make a selected component move right. |
Report Menu
The Report Designer'sReports Menu is a layout control menu which can toggle parts of your layout to be shown or hidden. Report Sections are parts of the report that are separate from other parts. some sections such as Header, Footer, and Summary have their own static purposes, while other miscellaneous groups such as Group1, Group2, Etc. can be used to display any static or database information you like.
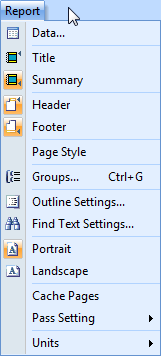
Groups
Groups are containers used to divide the sections of a report. Some sections can be static, their components never grow. Some groups can have lists taken from the database, and run with it for many pages. These groups are inserted from the groups window, located in the reports menu. (Please see screenshots).
In this window, you can see a list of existing groups (if any), and you can select the field to group them by from the dropdown menu above the list. Once you’ve selected your group, you can insert 1 or more of those groups. These groups get placed in your report, and can be set to dynamic or static height, by right clicking a group separator. Each group will divide the report in to separate sections (Header, Footer, Summary, Detail, etc.). some sections show up on every page, and some groups only show up on the first or last pages, so you should take this into consideration when inserting components, so you know where the best place to place it is, so that it shows up as many times as you need.
Data Source
Different report types come with different available component fields. Database field is a field of information stored in the CommitCRM database. These represent information in the database, which you’d like to have displayed in your reports. The available database fields list varies according to the report type.
Each report has a pre-defined list of available fields according to the report pre-defined design. In most cases, the main category fields are available (e.g. Ticket fields for a Ticket report, Charge fields for a Charge report, Account fields for all reports, etc.), and you may have some select fields from other categories as well (e.g. some based Account fields in a ticket report). Since the CommitCRM software is account-centric, each report can also be filtered by an account.
- For more information see Report Generation Options
Report Layout
This section describes the different sections that make up the Report Layout. Each section of the report can be resized to be able to include more information, and can also be set to dynamically resize itself by selecting the DynamicHeight option when right clicking a section bar.
The Header
- The Header is used to place report introduction information at the head of the report. This section get’s shown at the beginning of each page of the document. The header is ideal for showing the static information like report title, page number, print date, your company information and logo, etc.
For list reports it's also used to display the columns headers which should be displayed at the beginning of each page
- The Footer section is the last section of each page of the report to be printed. Like the header it gets printed once at the bottom of each page of the report. The footer/bottom group is ideal for displaying report comments, signature field, payment terms, warranty, etc.
Detail
- The Detail section is the area where the list data will be displayed. This should have the fields to be displayed in each column. When generating the report, the system will see how many records come up with the stipulations inputted in the report generation window, and print all the records in the detail section. (More on the report generation window later)
Summary
- This section in the report is located under the details section where your list will be displayed.
Sub-Reports
- The sub-reports tool allows you to generate a separated report within your main report, which is ideal for designing a separate part within the report. E.g. if you’re creating a ticket report, and you’d like to have that ticket’s charge report inside, then you’d generatea sub-report for the charge section. The sub-reports function is an advanced function, we recommend to make use of it only in reports which already have these sections within them. Adding your own sub reports can be tricky and should be consulted with the CommitCRM Support team first.
Generating Reports
The Report Generation window opens when you wish to generate a report. This window shows the fields available for filtering according to the report type. This is useful because we want to be able to filter and sort the data in our reports by different fields, depending on the type of report.
Report Generation Options
The report generator displays different options for each category of reports you choose to generate. In this section, we’ll cover the different filtering options for each screen, and explain their benefits. The report category can be selected from the CommitCRM > Reports Screen, and selecting the appropriate category. In this section, we will cover the more popular report categories and their options.
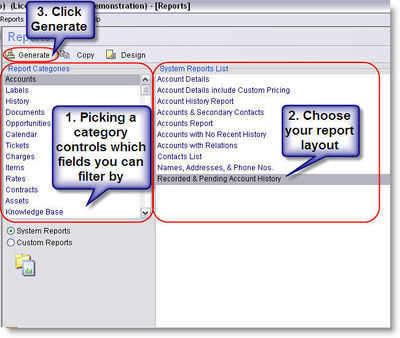
Account Report Generating Options
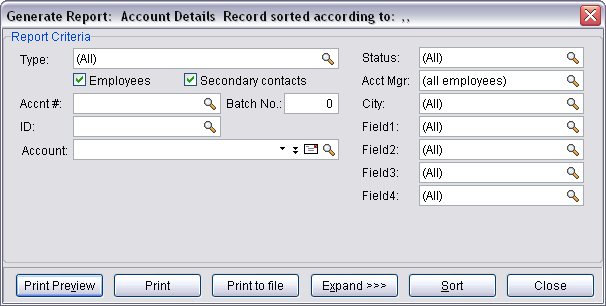
Account reports are used to display account details, and the generation window allows you to filter the results by various filtering options.
| Field | Description |
|---|---|
| Type | In this field you can choose which account type you wish to include in the report results. In addition, you can choose whether you wish to include Employees and Secondary Contacts in the report. |
| Accnt # | Allows you to filter the results by a specific account code so all accounts which contain this code in this field will be included in the results. The Accnt # code is alpha-numeric in essence, so numbers and letters can be used in the code. |
| Batch No | When importing accounts using the import tools, each imported account receives a batch number. This number can bee seen in the account's Notes tab. This way you can filter reports to show only account which were imported in a specific import. |
| ID | Allows you to filter the results by a specific account ID so all accounts which contain this number in this field will be included in the results. |
| Account | Allows you to filter the results to show only a single account. This option is similar to printing the report directly from the account window. |
| Status | Allows you to show only accounts with a specific status in your report. |
| Acct Mgr | Allows you to filter accounts by their Account Manager. The Account Manager is the employee assigned for this account. Note that if you wish to show accounts which do not have any account manager assigned to them, you can do this via the Advanced filters (use the Expand option), and using the "Empty" criteria. |
| City | Filtering accounts by a specific city is a common option, and therefore it is available from the main filtering window. For filtering according to other address fields, use the Expand option to reach other account fields. |
| Field1, Field2, etc. | The custom fields called Field1,2,3,4,5 that are user defined fields (many users rename these to their own needs) and are available in this window for filtering purposes. |
| Expand>> | Use this option to reach other Account fields in order to filter by advanced options. Use this option to find more robust filtering and sorting options for your report. |
Asset Report Generation Window
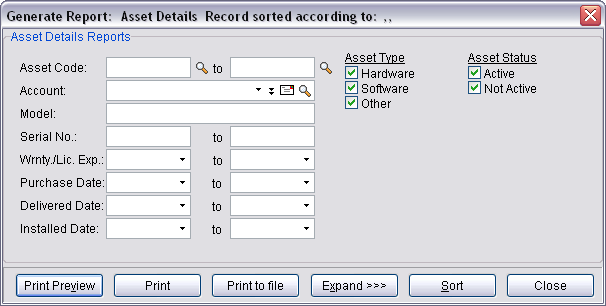
| Field | Description |
|---|---|
| Asset Code | This option will allow you to generate reports that are filtered to show assets with codes that are within the range defined. This is useful when you when you want to generate reports about assets that share similar codes. |
| Account | Allows you all assets for a specific Account. This is useful for periodic status reports regarding all assets filed under a single account. |
| Model | Allows you all assets with a specific model number. This is useful when generating reports that show all assets that you maintain that have the same model number/service tag. |
| Serial No | Allows you all assets within a range of serial numbers. This is useful when generating reports with similar serial numbers. |
| Wrnty./Lic. Exp | This option will display all assets whose warranties or licenses (HW/SW) are going to expire within a specific date range. This is useful when you want to notify your customers that these services need to be renewed before they expire. |
| Purchase Date | This option will allow you to show all assets purchased within a date range. This is useful when generating reports for any assets that have been purchased within a specific date range. |
| Delivery Date | This option will allow you to show all assets delivered from the vendor within a date range. This is useful when you need to generate reports for assets that you’ve received within a given date range. |
| Installed Date | This option will allow you to show all assets installed within a date range. This is useful when you need to report all work on assets that were installed within a given date range. |
| Asset Type (Hardware/Software/Other) | Marking any of these flags will trigger the selected asset types to be displayed in a generated report. This is useful when you want to monitor the the service you’ve provided for specific asset types. |
| Asset Status (Active/Not Active) | Marking any of these flags will trigger assets to be added to the report based on their activity status. This is useful when you only want to generate reports that have active or not-active assets. |
Charge Reports Generation Window
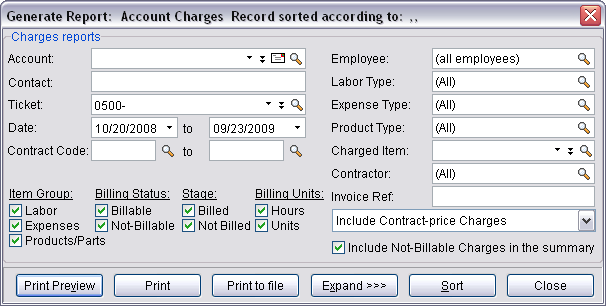
| Field | Description |
|---|---|
| Account | Allows you all charges for a specific Account. This is useful for periodic status reports regarding all charges filed under a single account. |
| Contact | This option will filter your reports to only display charges related to a specific secondary contact. This is useful when you want to report charges to your customers based on the specific contact the work was performed for specific contacts within a company. |
| Ticket | This option will filter your reports to only display charges related to a specific ticket. This is useful when generating reports based on a specific service ticket/call. |
| Date | This option will filter your reports to only display charges logged for dates within the specified date range. This is useful when you want to only show the charges issued within a specific time period (Last month, Last year). |
| Contract Code | This option will filter your reports to only display charges related to a contract within a specified range of contract codes. This is useful when you have several projects/contracts that you’re managing, that you want to view their charges in a consolidated report. The first time you renew a contract, the contract code is automatically suffixed with a numeric incremental value that grows each time you renew the contract. This makes generating charge reports that cross over multiple contract terms possible, so that you can generate your reports without being restricted to a specific contract. |
| Employee | This option will filter your report to only display charges created by specific employees. This is useful when periodically issuing payment to your technicians for work performed at customer venues. |
| Labor Type (Labor, Expense, Products/Parts) | Marking any option in the magnifying glass will show all charges with items of these types. This is useful when generating charge reports that only show Labor, Expense, and Product/Part charges. |
| Expense Type | This option will filter your report to only show charges of specific expense types. This is useful when filtering the different types of expenses from your report. |
| Charged Item | This option will filter your report to only show charges with a specific item charged. |
| Field1 | This option will filter your report to only show charges that match the criteria in the Field1 field. This is useful for customers that customize this field, and adopt their own internal use for the field, so that they can filter reports based on the customized field data. |
| Invoice Ref | Allows you to generate a report based on charges that have the same Invoice Reference Code given by QuickBooks. |
| Contract Price Charges | This option will control whether or not Contract Price Charges will be displayed in the report. Contract price charges are charges given to a contract, which represents the price charged for the contract. The Contract Price Charges can be copied to subsequent contracts, so that when a contract is copied, the price charge associated with the contract is copied it to the next account. |
| Include non billable charges in summary | This option controls whether non billable charges are also counted in the report summary section, which contains tax and total charge information for a charge report. This option helps to show your customers how much they are to be charged for a ticket, while still allowing you to print a similar report that will serve your back office workflow by showing you the real expense of the charges. |
| Item Group (Labor/Expenses/Products/Parts) | This option will filter your reports so they only display Charges with items in specific item groups. This option is useful in cases such as needing to generate a report for your employee, while only displaying the Labor Charges that were issued for your employee, so your employee can see how much he has earned. |
| Billing Status (Billable/Not-Billable) | This option will filter your reports so they only display billable or not-billable charges. This helps when running profit statistics based on the charge you do or do not bill for. |
| Stage | Here you can determine whether to include charges which are billed or not-billed in your report. |
| Billing Units | This option will filter your reports so they only display Charges with items billed by the unit/hour. |
Items Reports generation Window
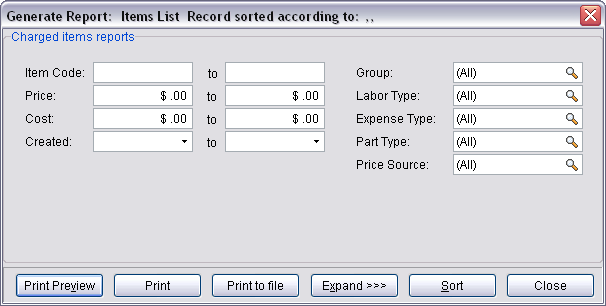
| Field | Description |
|---|---|
| Item Code | This option will filter your reports so they only display items within a specific Item Code range. This is helpful when running reports for all items with similar item codes determined by your business. |
| Price | This option will filter your reports so they only display items within a specific price range. This is useful when running reports for your items based on pricing grades, offered to your customers. |
| Cost | This option will filter your reports so they only display items within a specific cost range. The Cost field represents the price charged to your business to purchase the part/product, before selling the item. Your profit from each item consists of: Price – Cost = Profit. |
| Created | This option will filter your reports so they only display items created during a specific date range. This is useful when creating reports based on items that were created in CommitCRM in similar dates. |
| Group | This option will filter your reports so they only display items within a specific item group. Item Groups are divided into 3 different types of chargeable items:
Filtering these item groups comes in handy when you want to see how many expense charges were issued by specific employees in specific times, or even maintaining employee profitability based on labor charges issued by specific employees. |
| Item Sub Groups |
|
| Price Source (Fixed Price / By Employee Rate) | This option will filter your reports so they only display items using a specific price source. |
Ticket Reports Generation Window
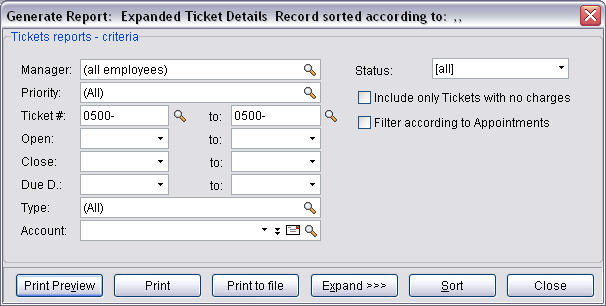
| Field | Description |
|---|---|
| Manager | This option will filter your reports so they only display tickets assigned to specific managers. Ticket managers are the employees in charge of each tickets workflow, and customer relation. Each ticket managers responsibility is to see the tickets opened for him resolved and closed in the timeliest manner possible. |
| Priority | This option will filter your reports so they only display tickets according to their priority. Ticket priorities indicate how quick a ticket should be serviced, and the haste to perform the work needed to resolve the ticket. |
| Ticket # | This option will filter your reports so they only display tickets within a specific ticket number range. Ticket numbers are numeric in nature, and the number automatically progresses from ticket to ticket. once a ticket has been given a number, that number cannot be changed unless the ticket has been copied to a new ticket. |
| Open | This option will filter your reports so they only display tickets opened within a specific date range. This is useful when you want to follow the tickets opened for a specific customer or manager in a specific timeframe meaning the last day/week/month/year. |
| Close | This option will filter your reports so they only display tickets closed within a specific date range. This option is useful if you want a filtered list sorted and displayed in relation to the time that the ticket has been closed in. |
| Due D. | This option will filter your reports so they only display tickets marked as due within a specific date range. This option helps to generate reports that take into account the time a ticket was marked as due. |
| Type | This option will filter your reports so they only display tickets marked with specific types. Ticket types refer to the type category which includes types such as Hardware, Installation, Software, Upgrade, etc. This helps to generate statistics to see what types of additional staff you would need to upgrade your business with. |
| Account | This option will filter your reports so they only display tickets opened for a specific account. Filtering your ticket reports for specific accounts allows you to generate verbose customer activity reports that you can use if extensive research of the account is necessary. |
| Status | This option will filter your reports so they only display tickets marked with specific statuses. This way you can easily see only New tickets, Assigned tickets, etc. Note that you can also filter by ticket status groups (Open, In Service, Closed, All). |
| Include only tickets with no charges | Shows only tickets that do not have any charges created for them. Filtering your ticket list to reflect only the tickets without any charges helps to generate reports that follow all the tickets you forgot to charge, helping you to charge more and bill your customers for all the work you've performed. |
| Filter according to appointments | Shows only tickets that have been dispatched to have appointments created for them. Using this feature allows you to reports based on whether appointments have been scheduled for them. When selecting this option, more fields are displayed allowing you to print reports for only for tickets that have appointments scheduled within the time frame you've set. also, this option also allows you to filter these reports by the employee that has the appointment. For example, Brian can print all the Technician Service Forms he needs for the whole day and take them with him onsite. |
Advanced Filtering
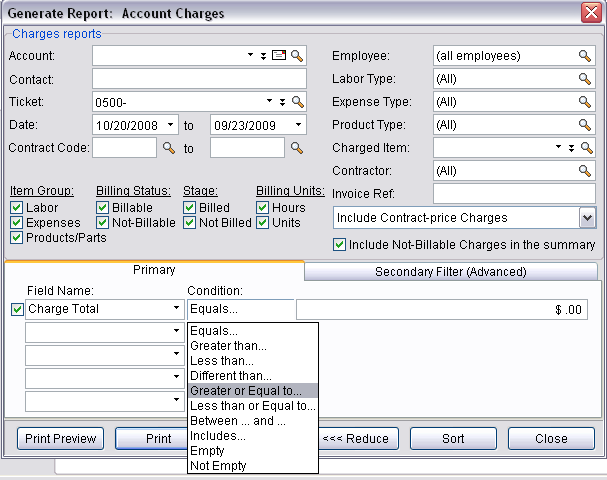
Using the Advanced filtering tools via the Expand >> button, you can set the system to generate reports based on advanced filtering settings. Advanced Filtering lets you filter by fields which are not listed in the above section. These filters can be set to decide if to generate a report based on almost any of the data set to be printed. Through these options, you can filter the report to your needs.
Primary Filters
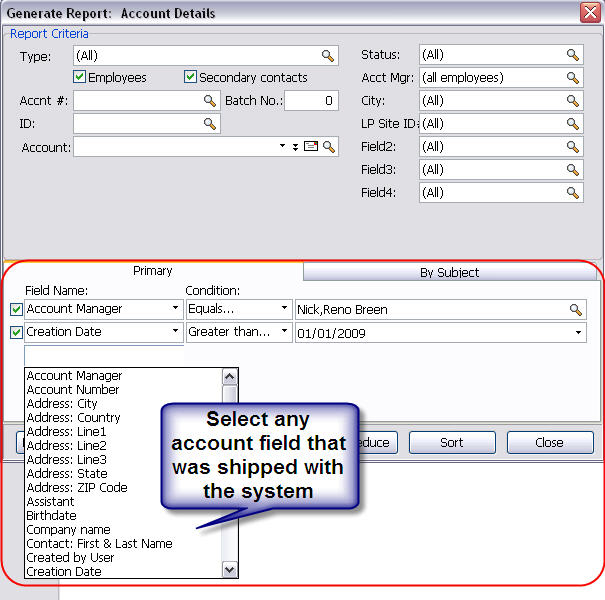
- The primary tab is used to let you filter your report based on all predefined system fields that comes with the system. in this part of the screen, you can set several filters that can be enabled at the same time. These filters would work side-by-side, and select additional entities to have reports generated for them. for each rule you want to add, you need to follow these steps:
- Select a field in the advanced filter rule list.
- Select the type of rule.
- Select the value to be shown in the report.
- Add more rules to include more data - Optional
Secondary Filters
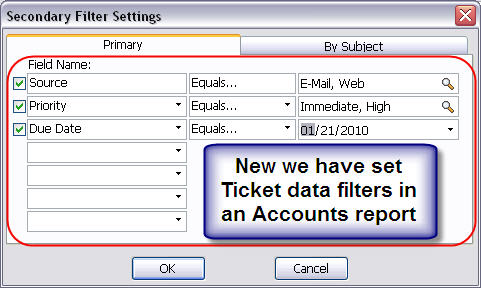
When using reports that mix multiple data sources in the same report, it may sometimes become necessary to apply second level filtering options in order to narrow the list down to the items you need to be displayed in your report. The secondary filters allow you to create super-advanced filters on the report results, and narrow down the results to exactly what you want to see. For example, this means that you can generate Charge reports, and narrow the results by specific ticket type, which reflects the type of problem (i.e. printer, mobile phone, laptop etc.,). This feature is quite powerful, and once you have all the logged work information in the database (i.e. Charges), the analytic possibilities are great Other examples:
- Filter Ticket reports to display only Tickets related to Accounts to which a specific employee is assigned
- Filter Charge reports to display all Charges logged for Block of Time Contracts that belong to Accounts which are assigned to a specific employee
- Filter Charge reports to display only Charges for Completed Tickets that belong to Accounts of the type 'Law Office'
Using Secondary Filters
The mentioned above, the secondary filter is available in specific report categories that mix data sources. These categories include Charges, Tickets, Opportunities, Assets and Contracts, and can be accessed by:
- Opening a report generation window.
- Using the Expand>> option.
- Selecting the Secondary Filter Tab.
Once the secondary filter tab has been opened, you can select different data sources that are available in the report, and set the needed filters that each data source offers you. Once this is done, your report will be filtered to only include database entities that fall in the rules you've set.
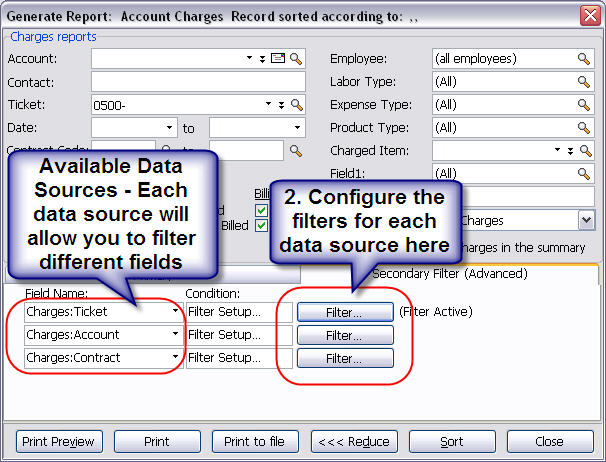
Once you've chosen the data source you want to filter your report by, you can click the filter button
Secondary Filters Based on Custom Fields
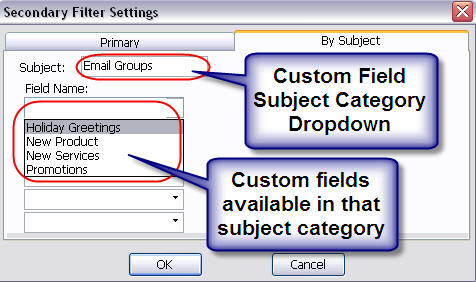
When you need to have your secondary filter applied to data that you have stored using custom fields, you can easily filter these fields by using the By Subject tab. Once you've opened the tab, the different Custom Field Subject Categories you've created in the system are displayed from the current data source you've selected, and once you've picked a Subject, you'll be able to choose the fields you want to include from that Subject.
By Subject Filters
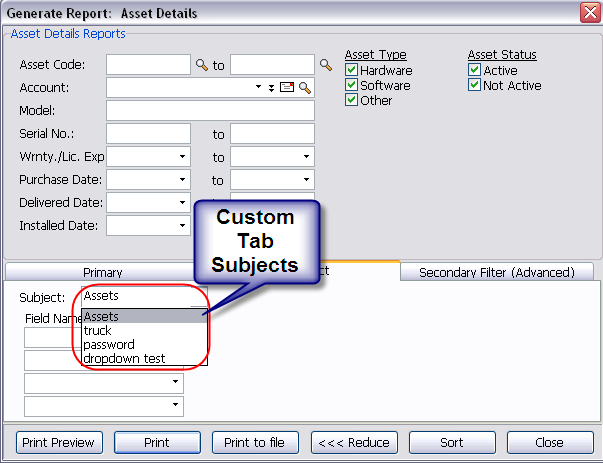
For reports which have user-defined fields, you will notice a tab called "By Subject" which allows you to filter the report according to the user-defined fields. Here you can choose the subject you want to filter by, and this will give you the relevant field list for this subject. A subject is basically a fields-group, which can be defined when adding new fields. For more details about adding your own fields, click here.
Advanced Sorting
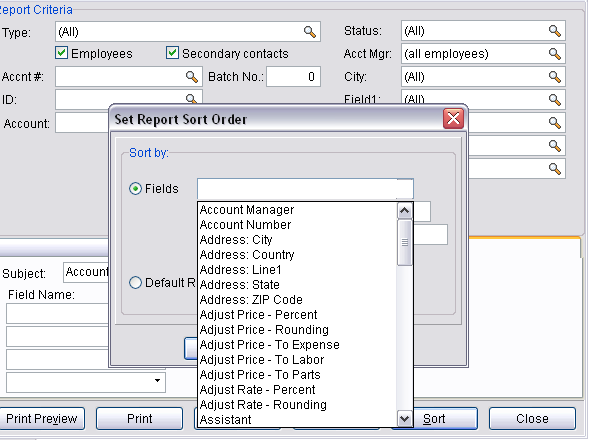
The advanced sorting feature allows you to reorganize the data printed in your reports to be sorted to your needs in your reports. Here you can tell the program to print the items in any order you choose. The options available to you in this option are system wide. We suggest sorting the list by a field displayed in the report, or just to use the default report setting.
Generating and Printing Reports Using the Commit Web Interface
The Commit Web Interface is most known for it’s portability, and the control it offers the you from any location in the world. The Commit Web Interface also has the ability to generate PDF reports for your technicians to give to your customer while your technician is onsite at your customers’ venue. For more information see Genetating and Printing Reports Using the Commit Web Interface.
Frequently Asked Questions
The Report Designers FAQ page also includes lots of useful tips and workflows that would greatly ease the transition into customizing of your CommitCRM reports. For more information see Reports FAQ.


